Features
-
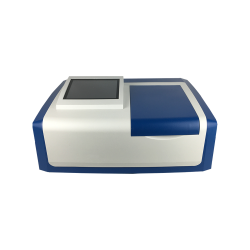
8-inch touchscreen display with a dual-beam optical system
-
Examine the entire spectrum
-
Linear regression analysis
-
The innovative user interface, powerful functions, and simple operation
-
Direct reading with concentration
-
Persistence of time-based kinetics
-
Detecting Peaks and Valleys
-
It shows great performance in qualitative and quantitative analysis
-
Measurement of multiple wavelengths
-
Extensive frequency band scanning
-
The zero and full scales are automatically adjusted
-
A USB interface is included
Specifications
|
Monochromatic type |
Czerny turner |
|
Focal length |
160 mm |
|
Wavelength Range |
190 to 1100 nm |
|
Band Width |
1.8 nm |
|
Wavelength Accuracy |
±0.3 nm |
|
Wavelength Repeatability |
≤0.01 nm |
|
Photometric Display Range |
0.0 to 200 .0% T , -0.301 to 4.000 A , 0.000 to 9999 C |
|
Photometric Accuracy |
±0.3% T(0 to 100%T) / ±0.002A(0 to 0.5A) / ±0.004A(0.5A to1A) |
|
Photometric Repeatability |
0.15% T(0 to 100%T) / ±0.001A(0 to 0.5A) / ±0.002A(0.5A to 1A) |
|
Photometric Mode |
T,A,C,E |
|
Stray Light |
≤0.03% τ (220nm NaI, 360 nm NaNO2) |
|
Stability |
0.0005A/h500 nm |
|
Detector |
Import Silicon Photodiode |
|
Scanning speed |
Fast-medium-slow |
|
Power Requirement |
AC 220 V±22 50 Hz±1 Hz,200 W |
|
Baseline Flatness |
≤0.002A(200 to1090 nm) |
|
Grating |
1200 lines/mm |
|
Drifting |
≤0.0009 Abs/30 min |
|
Noise |
100 % (T)≤0.15 % (T); 0 % (T)≤0.1 % (T) |
|
Dimensions(W×D×H) |
74×63×45 Cm |
|
Weight |
35 Kg |
Application
It is to determine the amount of light of a specific wavelength absorbed by an analyte in a sample. Although samples can be gases or liquids, an analyte dissolved in a solvent is discussed here.